RX DRUG ABUSE
The Lexington Herald-Leader has a series of articles, as part of a special
report, in Sunday's (1-19-03) paper
http://www.kentucky.com/mld/heraldleader/news/special_packages/.
One in particular charts distribution of those narcotics tracked by D.E.A.
down to the retail level. For those unfamiliar with the D.E.A. ARCOS system,
it provides data by the first three digits of zip codes through which one can
see how much of particular controlled substances (by drug type, not by
product) is distributed in different parts of the country. ARCOS does not
track dispensing or prescribing to individuals; rather it tracks how much is
ordered from manufacturers or wholesalers by such as pharmacies, hospitals,
and physicians within each triple digit zip area.
For example, the data was used by David Joranson in the 1970s to chart a
remarkable "spike" in per capita ordering of amphetamines in Madison,
Wisconsin, which was largely traceable to two doctors. I used the data in
the mid-1980s to show that per capita distribution of certain drugs was
unexplainably (at least legitimately) much higher in certain parts of
California (where some prescription drug "mills" were located) than in other
areas. For example, the per capita distribution of phenmetrazine hcl
(Preludin) in Long Beach, California was 600 times that in Sacramento County,
areas of roughly the same population at the time (this was part of a joint
federal-state operation to close down the worst of Los Angeles area
prescribers who were issuing illegitimate prescriptions for various narcotic
and non-narcotic controlled substances, such as Dilaudid, Preludin, Ritalin,
codeine compounds and non-narcotic controlled substances such as Doriden
(gluthethimide) and certain benzos).
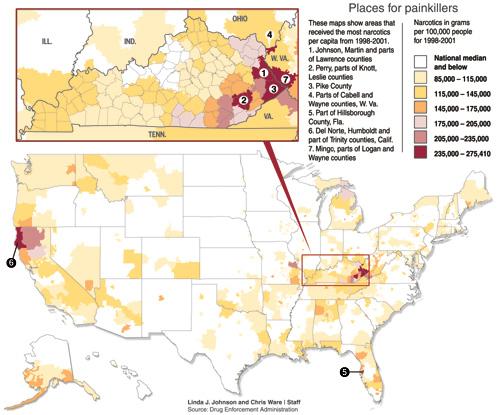
The map, which is part of the Herald-Leader's special report shows per capita
distribution of narcotics tracked through ARCOS from 1998-2001. For good or
ill, all but a very few locations in the U.S. are at, or below, the national
median. Only seven areas are roughly triple or more the national median, of
which 5 are in Eastern Kentucky or West Virginia, one is in part of
Hillsborough County, Florida, and the other is in Del Norte and Humboldt and
part of Trinity County in California (for reference, this is adjacent to
Shasta County, which is where Redding is; Shasta County also ranked well
above the national per capita, roughly 2.4-2.8 times the national per
capita).
Bill Marcus, J.D.
Canoga Park CA
IN THE AREAS OF HIGHEST USE::
250,000 grams/100,000 people/1460 days in 4 years, from 1998-2001=1.7 mg of �narcotic� per day per person (in the general population)
Assume that 20% of the population suffers from chronic pain, which is conservative, based on the surveys:
5 X 1.7 mg/day = 8.7 mg/day per chronic pain sufferer
(this is the equivalent of ~1 extra strength Vicodin per day per pain sufferer!!)
(this calculation doesn�t take into account the �narcotics� used in the treatment of either acute or terminal pain)
Do the Math.
Frank B. Fisher, M.D.